Revenue is up. Profit has increased. Cash flow has changed. What can these numbers tell us about a business?
Annual reports offer a fantastic opportunity to bring real-world business information into the classroom. They're full of insights into how businesses operate, the decisions they make, the challenges they navigate, and how they measure success.
But you don't need to explore every page or understand every financial statement to make good use of them. Sometimes, just a few numbers are enough to spark a great business discussion.
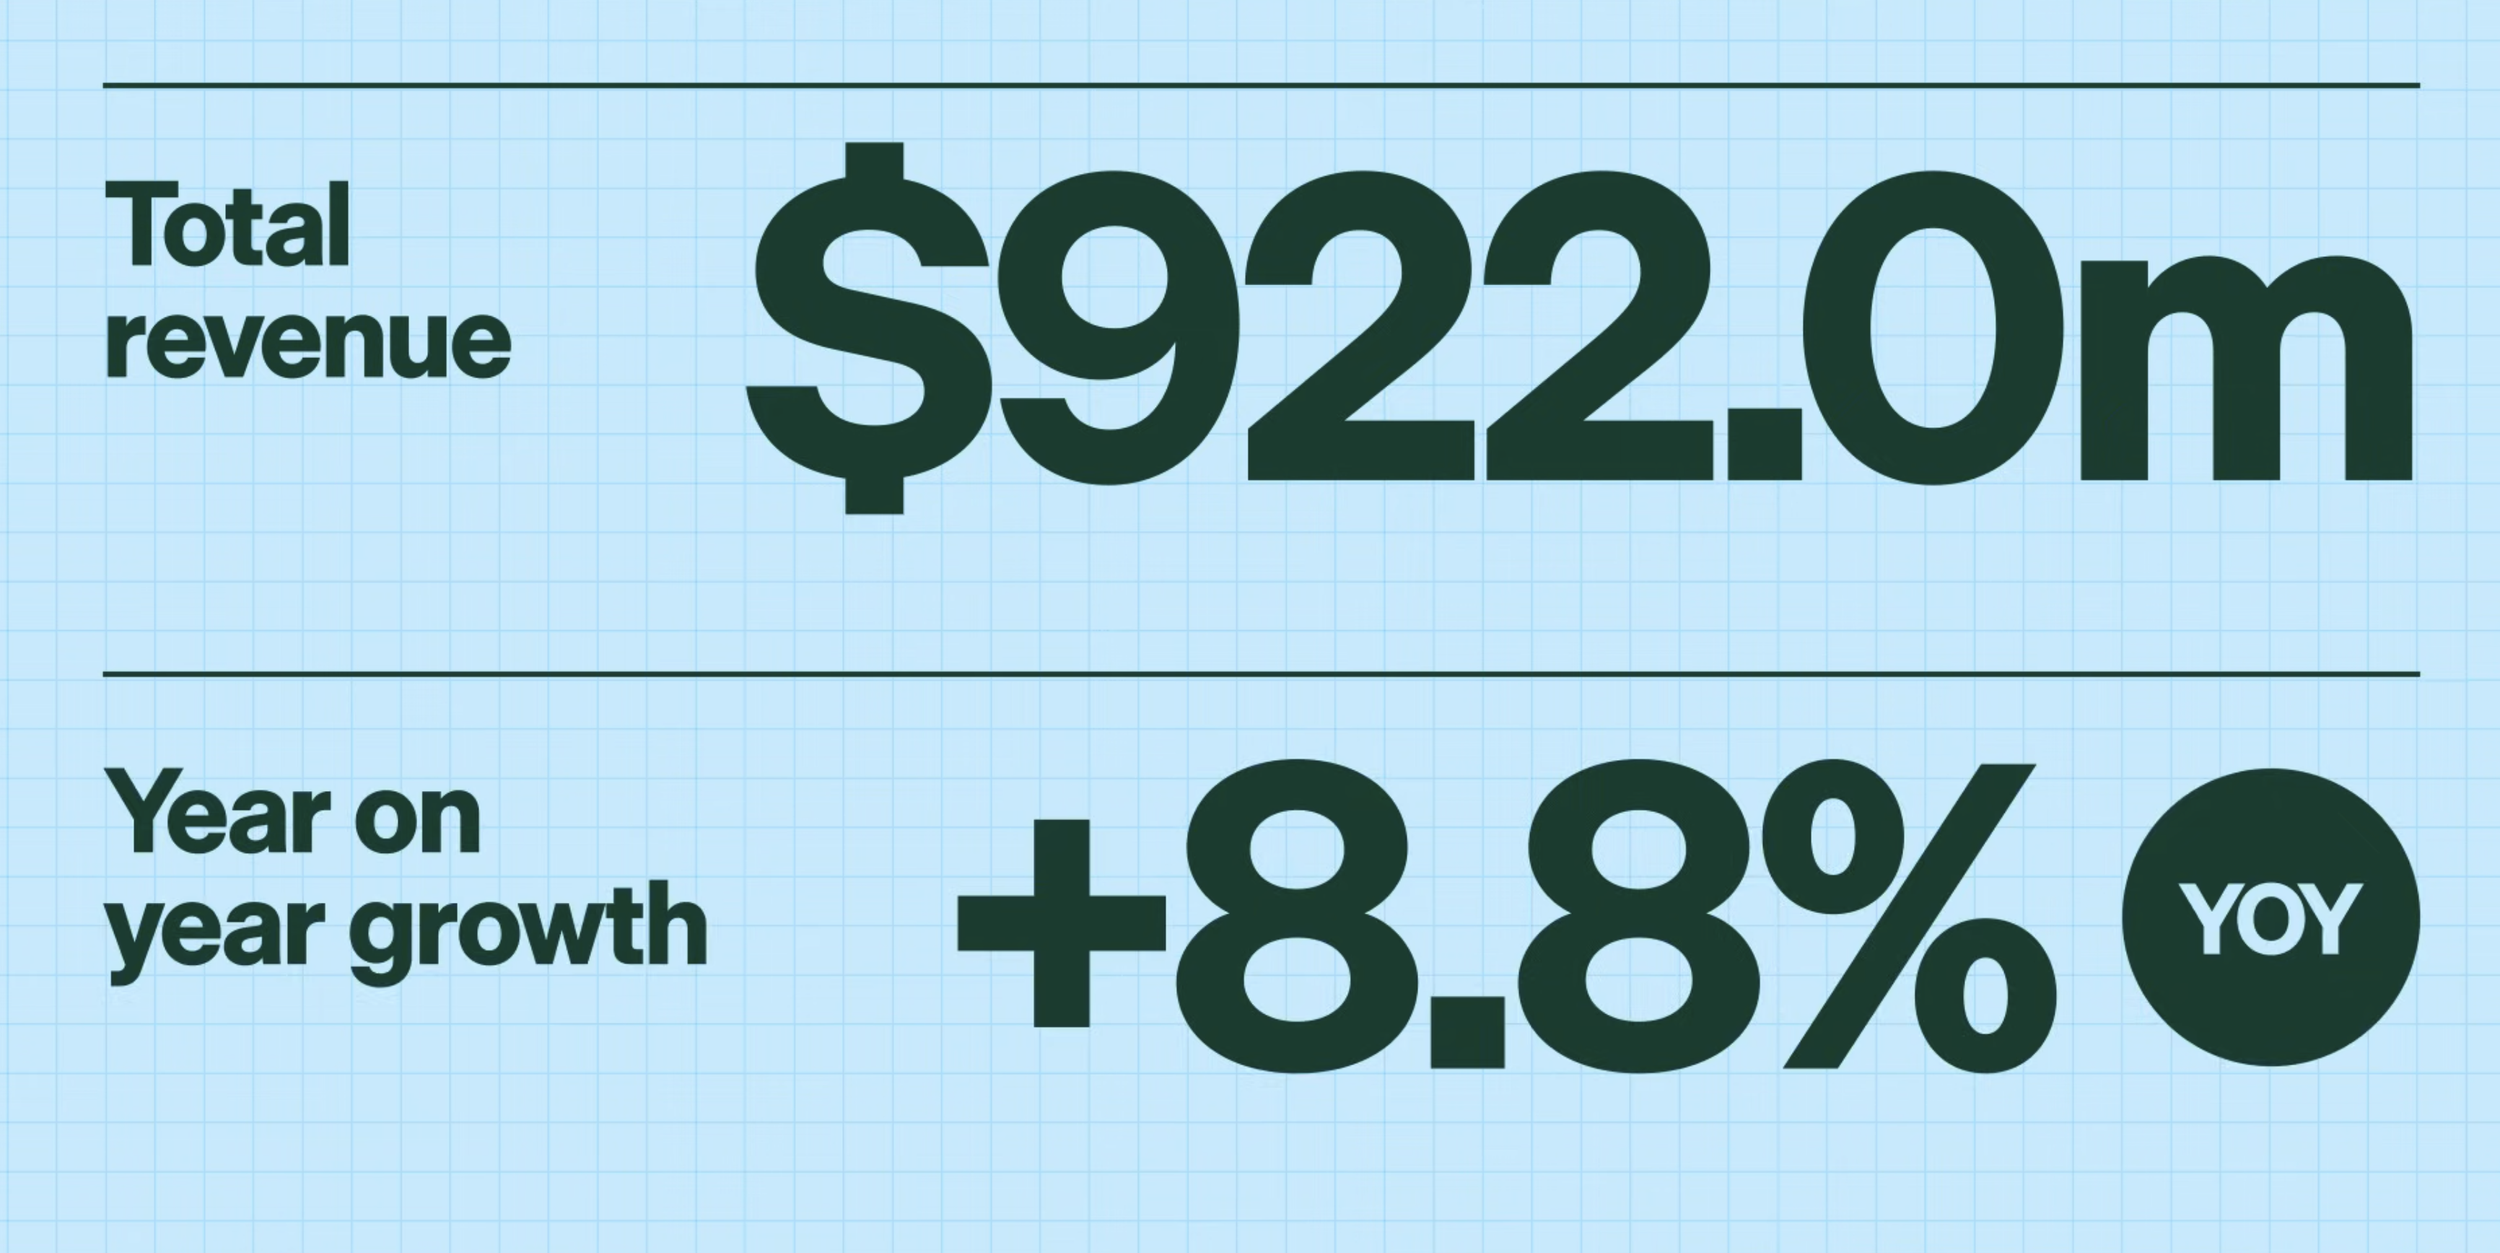
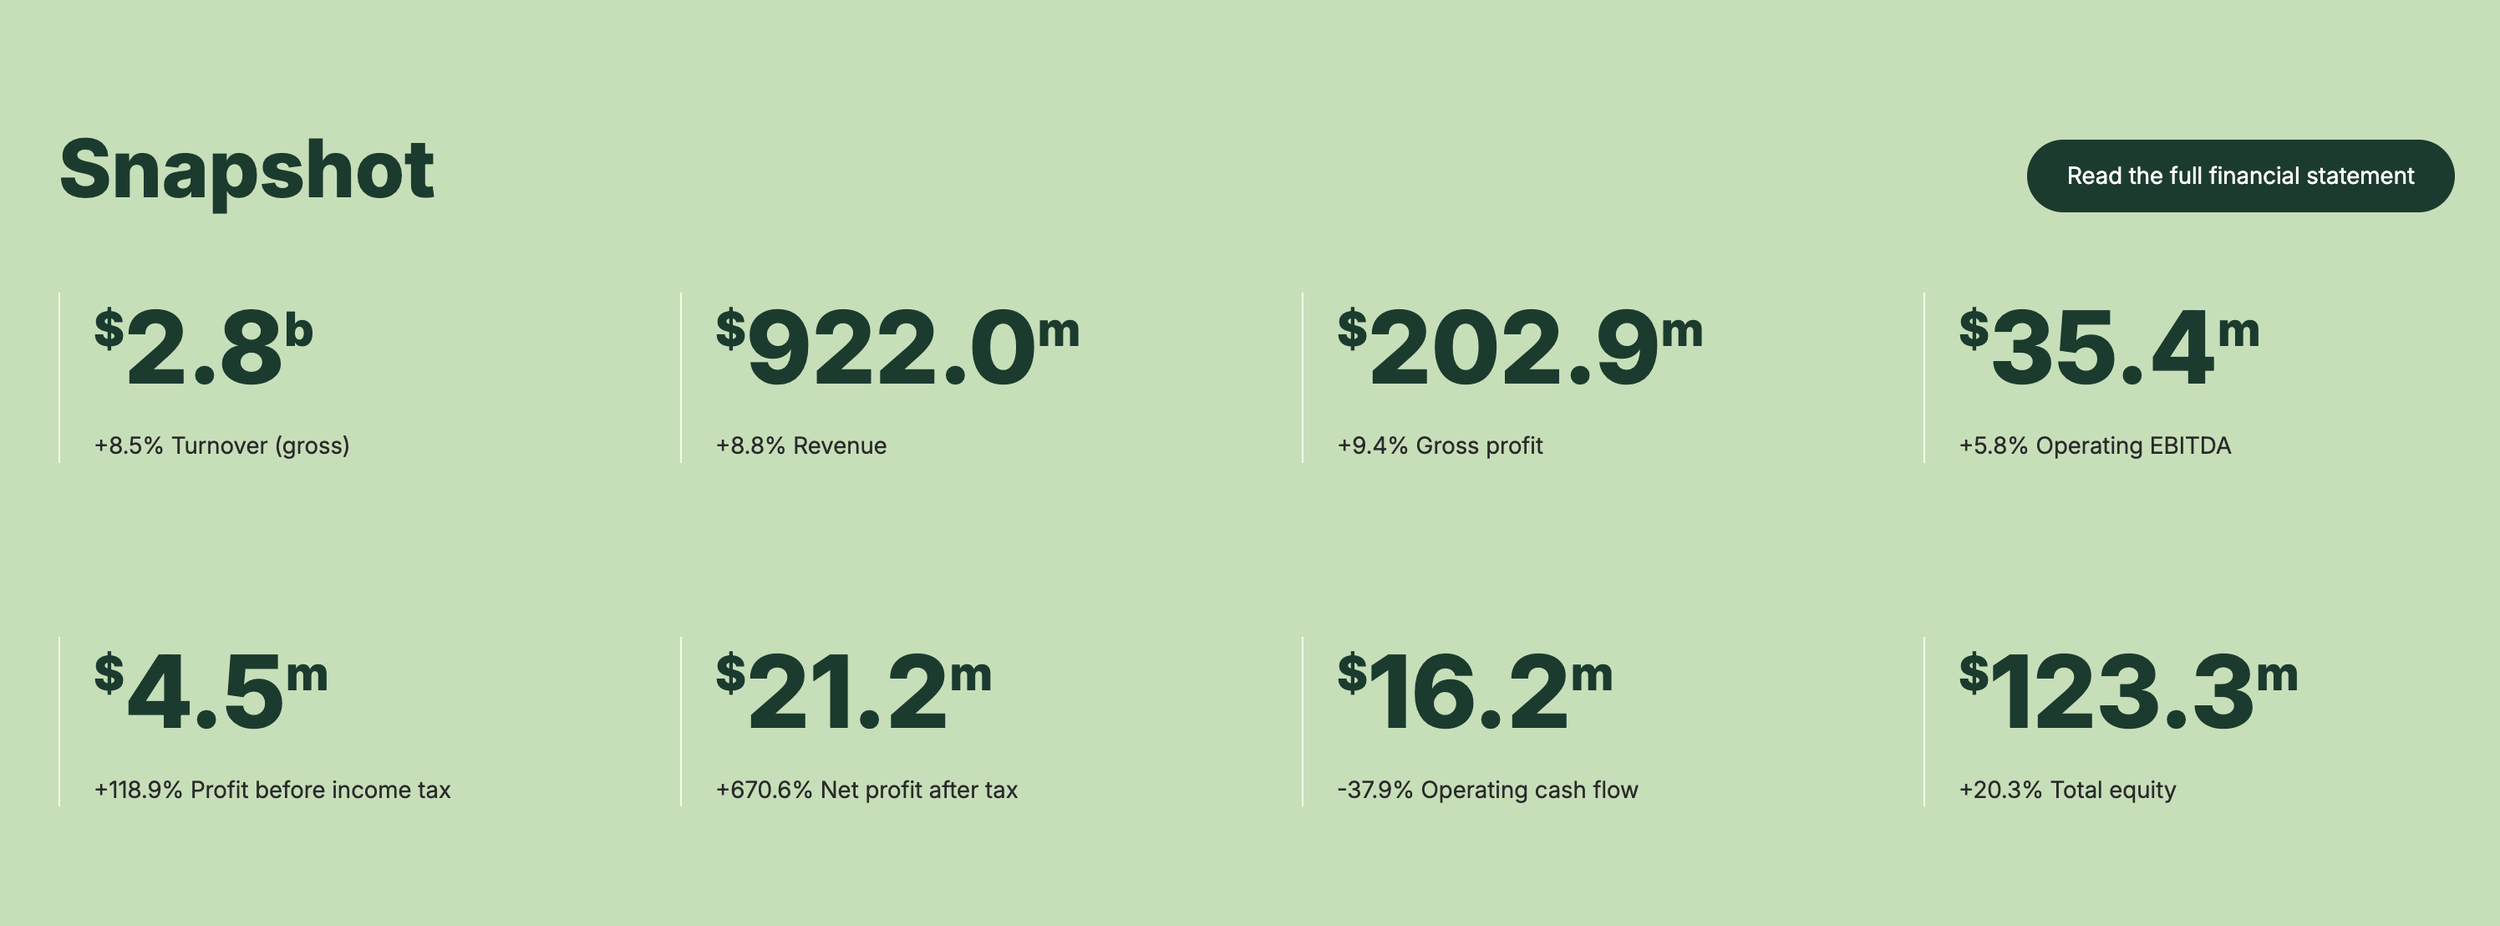
Take Farmlands' recently released 2026 Annual Report. Revenue increased, profit before tax more than doubled, while operating cash flow decreased. Each figure tells us something different about the business, and together they provide an opportunity for students to explore what business performance really means.
What might explain the differences? Which figures would different stakeholders be most interested in? What else would we want to know before drawing conclusions?
These are the kinds of questions that help students move beyond simply identifying financial terms to thinking about what the numbers mean, how they connect, and what they might tell us about business decisions.
That's where the learning happens. Students don't need to analyse an entire annual report. They can start by finding a few key figures, comparing them, asking questions, and building their understanding from there
We've used Farmlands' annual report to put together some practical classroom prompts, along with links to a short video, the annual report, and consolidated financial statements.
Head over to the Ripyl Community Feed to explore the prompts and get your students thinking about the stories behind real business numbers.
Image sources from: https://www.farmlands.co.nz/about/annual-reports/2026